Yet Another View on Citation
Scores
Wil van der Aalst
3-1-2023
“How to evaluate scientific research?” is a
controversial topic. The easiest way to evaluate productivity and impact is to
count the number of published papers and the number of citations. Clearly, this
is very naïve because it is possible to publish many papers that are
incremental or of low quality. Counting the total number of citations has the
problem that one may be a co-author of a single high-cited paper. This does not
say much about the contribution of the author, and citations tend to follow a
power-law distribution (i.e., just a few papers attract most of the citations).
To address the limitations of simply counting papers and citations, the
scientific community has created journal and conference rankings, and metrics
like the Hirsch index (first proposed by Jorge Hirsh in 2005, and adapted in
many different ways).
Of course, all of these measures should be taken with a grain of salt. In the Netherlands,
the “Recognition and Rewards” (“Erkennen en Waarderen”) program [6] was initiated
to improve the evaluation of academics and to give credits to people working in
teams or focusing on teaching. Similar initiatives can be
seen in other countries and at the European level [7]. Although the
goals of such programs are reasonable and it is impossible to disagree with
statements such as “quality is more important than quantity” and “one should
recognize and value team performance and interdisciplinary research”, suitable
measures are lacking. Such programs are often used to
abandon any measure to quantify and evaluate productivity and impact. In some
universities, it has even become “politically incorrect” to talk about
published papers and the number of citations. Yet, when evaluating and
selecting academics, committee members still secretly look at the data provided
by Google Scholar, Scopus, and Web of Science. This is because it is difficult
to evaluate and compare academic performance in an objective and qualitative
way. This creates the risk that
evaluations and selections become highly subjective, e.g., based on taste,
personal preferences, and criteria not known to the individuals evaluated.
Moreover, in such processes, quantitative data are still used, but in an
implicit and inconsistent manner.
Given the above, my personal opinion is that we cannot avoid using objective data-driven
approaches to evaluate productivity and impact. Of course, quantitative measures should only support expert assessment and are not
a substitute for informed judgment.
When using citation scores, one should definitely consider the “Leiden
Manifesto for research metrics” [1], which provides ten principles to guide
research evaluations.
Some of the practical challenges
that I see in research evaluations are the following:
·
Subjectivity. Rankings of
journals and conferences tend to be problematic. Journal lists are highly
subjective. For example, in the field of Information Systems, the “College of
Senior Scholars” selected a “basket” of journals as the top journals in their field.
However, the definition of Information Systems is considered
in a very particular manner, mostly driven by non-technical US-based academics
publishing in these journals and serving on the editorial boards of the
journals they select. The CORE ranking of conferences is much broader, but has
similar problems (e.g., the ranking was established by
a few computer
departments in Australia and New Zealand and is now used all over the globe to
decide on research funding and travel budgets). The intentions behind these
lists are good. However, it is
unavoidable that there are topical biases and scoping issues. Moreover,
such rankings are like a self-fulfilling prophecy. This leads to a variant of
the Matthew effect (“the rich get
richer”), i.e., the higher the ranking of a conference or journal, the more
people want to submit to it, automatically leading to a higher status. This
combined with a narrow focus, leads to a degenerate view of research quality
and discourages innovations in new directions. Although research is changing
rapidly, these journal lists tend to be relatively stable. Moreover, highly-ranked journals and conferences have many papers that
are rarely cited. Hence, just looking at the publication venue says little
about the quality, novelty, and impact of the work.
·
Biased data sources
and data quality problems. There are multiple
databases that can
be used to evaluate productivity and impact, e.g., Elsevier’s Scopus and Google
Scholar (both released in 2004) and Web of Science (online since 2002). Also,
dedicated tools running on top of these platforms, such as InCites
(using the Web of Science) and SciVal (using Scopus),
have been developed. Web of Science has a strong focus on journals published in
the US and favors traditional disciplines such as Physics. Conferences are only
partially covered. For a researcher in Computer Science, the number of
citations in Google Scholar may be 2-3 times higher than the number of
citations in Scopus, and over 10 times the number of citations in Web of
Science! For a researcher in Physics, the differences between Google Scholar,
Scopus, and Web of Science may be much smaller. This means that Web of Science
is simply irrelevant for many disciplines. Google Scholar has the most
extensive coverage, but also data quality problems. Google Scholar simply
crawls academic-related websites and also counts
non-peer-reviewed documents. One may also find stray citations where minor
variations in referencing lead to duplicate records for the same paper [8]. Also, Scopus and Web of Science have such problems, but to a
lesser degree. In Microsoft Academic Graph, my output and citations were split over eight different user profiles due to my last
name (“W. van der Aalst”, “Van der Aalst”, etc.). Although Microsoft Academic
Graph was discontinued, these flawed data are still
used in all kinds of rankings (e.g. Research.com). These examples illustrate that
the impact of data quality problems and limited coverage are not equally
distributed. Considering data quality and coverage, Scopus can
be seen as the “middle road”.
·
Different
publication practices. Finally, there are different publication traditions that significantly
impact the most common measures used today. In many
disciplines, the average number of authors is around two. However, in areas
like physics, the average is above ten authors, and there are papers with
hundreds or even thousands of authors. An article on measuring the Higgs Boson
Mass published in Physical Review Letters has 5,154 authors (cf. https://link.aps.org/doi/10.1103/PhysRevLett.114.191803). This 33-page
article has 24 pages to list the authors, and only 9
pages are devoted to the actual paper. When counting H-indices in the standard
way, this paper will increase the H-index by one for more than 5000 authors. Also, the order in which authors are listed varies from
discipline to discipline. In mathematics, it is common to list authors
alphabetically. In other disciplines, the order is based
on contribution. Also, the “last author” position may
have a specific meaning (e.g., the project leader or most senior researcher). Also, in Computer Science, conference publications are
regarded as important and comparable to journal publications. In other areas,
conference publications “do not count”, and all work is
published in journals. The above shows that counting just journal papers
while ignoring the number of authors may have hugely diverging consequences for
different disciplines.
These challenges are hard to address. However,
as stated before, I do not think it is
wise to resort to subjective evaluations of research productivity and impact while
ignoring the data that are there. Therefore, I liked the approach and work presented by John
Ioannidis and his colleagues [2,3,4,5]. Ioannidis
et al. propose to use a composite
indicator (called C-score) which
is the sum of the standardized six log-transformed citation indicators (NC, H, Hm,
NS, NSF, NSFL):
·
total number
of citations received (NC),
·
Hirsch index
for the citations received (H),
·
Schreiber
co-authorship adjusted Hm index for the citations
received (Hm).
·
total number
of citations received to papers for which the scientist is single author (NCS),
·
total number
of citations received to papers for which the scientist is single or first
author (NCSF), and
·
total number of citations received to papers for which
the scientist is single, first, or last author (NCSFL).
The
resulting C-score focuses on impact
(citations) rather than productivity (number of publications) and incorporates
information on co-authorship and author positions (single, first, last author).
Each NC, H, Hm,
NS, NSF, NSFL score is normalized to a value between 0 and 1, and these are
summed up. Hence, the C-score has a
range between 0 and 6.
In
the dataset [2], data for 194,983 scientists are reported.
The selection is based on the top 100.000 scientists by C-score (with and without self-citations) or a percentile rank of
2% or above in the subfield. The researchers are classified
into 22 scientific fields and 174 sub-fields. The dataset is
based on all Scopus author profiles as of September 1, 2022. Scopus can be seen as the middle ground between Google Scholar and
Web of Science. As mentioned, Google Scholar has much better coverage, but also
more data quality problems. Web of Science is unusable for many disciplines due
to its bias towards specific types of journals. Note that Ioannidis et al. tried
to avoid the problems mentioned before, i.e., they aimed to avoid subjectivity
and biased data, addressed data quality problems, and compensated for different
publication practices (e.g., the number of authors).
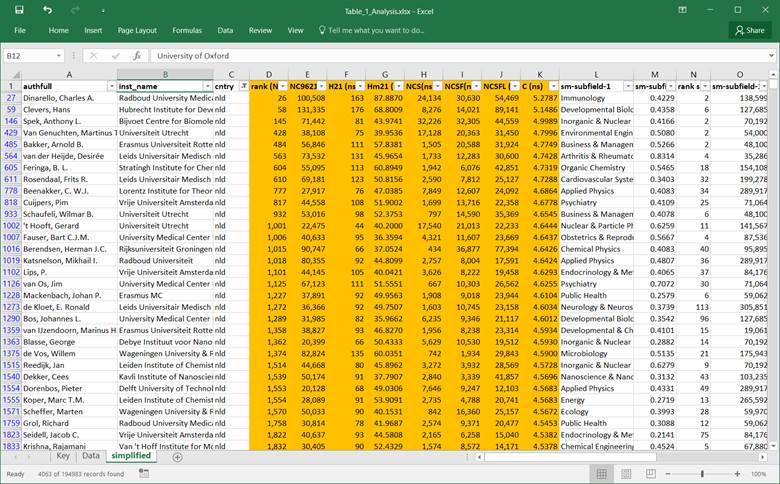
The data set [2] looks as follows
(after hiding some of the columns and showing the first 40 rows):
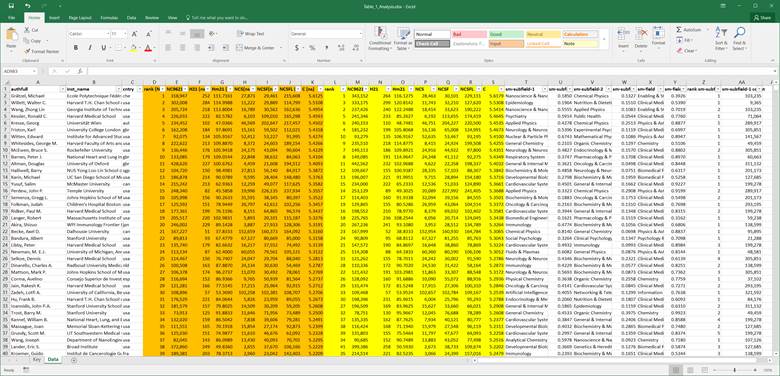
The
first three columns show the author, institution, and country. The orange
columns show the NC, H, Hm, NS, NSF, NSFL, and C values for each author ignoring self-citations. The first orange
column shows the overall rank based
on the C-score, and the last orange
column shows the C-score itself
(with a value between 0 and 6). The yellow columns
show the NC, H, Hm,
NS, NSF, NSFL, and C values for each author, including
self-citations. The final columns aim to show the positioning of the author’s
work in the respective subfields. The top-ranked Science-Metrix category and
second-ranked Science-Metrix category are listed per
author, including the fraction of papers in these fields, the C-score-based ranking in the top-ranked
field, and the total number of authors within the subfield.
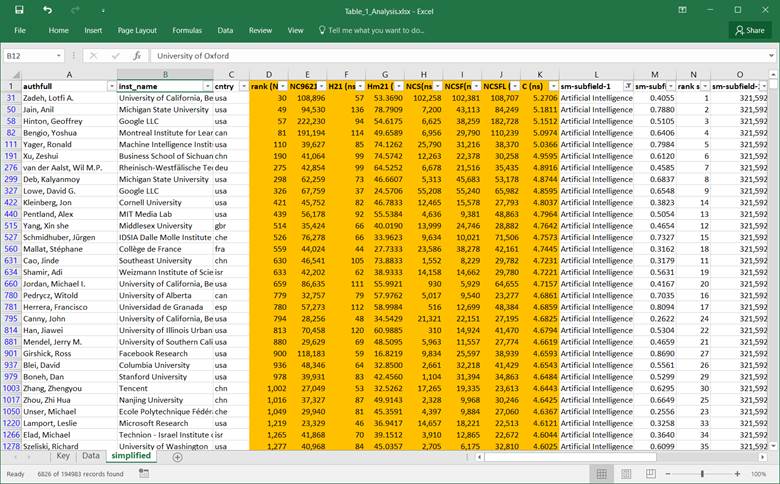
To illustrate the data
[2], I take myself as an example:
·
Author name: van der Aalst, Wil M.P.
·
Institution:
Rheinisch-Westfälische Technische Hochschule Aachen
·
Country: deu
(Germany)
·
Without self-citations:
o
total number
of citations received (NC): 42,854
o
Hirsch index
for the citations received (H): 99
o
Schreiber
co-authorship adjusted Hm index for the citations
received (Hm):
64
o
total number
of citations received to papers for which the scientist is single author (NCS): 6,678
o
total number
of citations received to papers for which the scientist is single or first
author (NCSF): 21,516
o
total number
of citations received to papers for which the scientist is single, first, or
last author (NCSFL): 35,435
o
C-score:
4.8916
o
Global rank across all fields based on C-score: 275
·
Including self-citations:
o
total number
of citations received (NC): 50,145
o
Hirsch index
for the citations received (H): 107
o
Schreiber
co-authorship adjusted Hm index for the citations
received (Hm):
68
o
total number
of citations received to papers for which the scientist is single author (NCS): 7,365
o
total number
of citations received to papers for which the scientist is single or first
author (NCSF): 24,116
o
total number
of citations received to papers for which the scientist is single, first, or
last author (NCSFL): 41,397
o
C-score:
4.9370
o
Global rank across all fields based on C-score: 243
·
First subfield: Artificial Intelligence & Image Processing
·
Fraction of papers in the first subfield: 0.4585
·
Second subfield: Information & Communication Technologies
·
Fraction of papers in the second subfield: 0.1444
·
Global ranking within the first subfield based on
C-score: 7
·
Number of researchers in the first subfield: 321,592
Hence,
my global ranking based on the C-score
not considering self-citations is 275, my global ranking based on the C-score also considering self-citations
is 243, and I’m ranked 7th among the 321,592 in Artificial
Intelligence & Image Processing.
The
above describes one row in the table shown before. To further improve
readability, I removed the columns related to the second subfield and only
considered the citations, excluding self-citations. The top 25 authors based on
C-score are then readable, and the
top view is as follows:
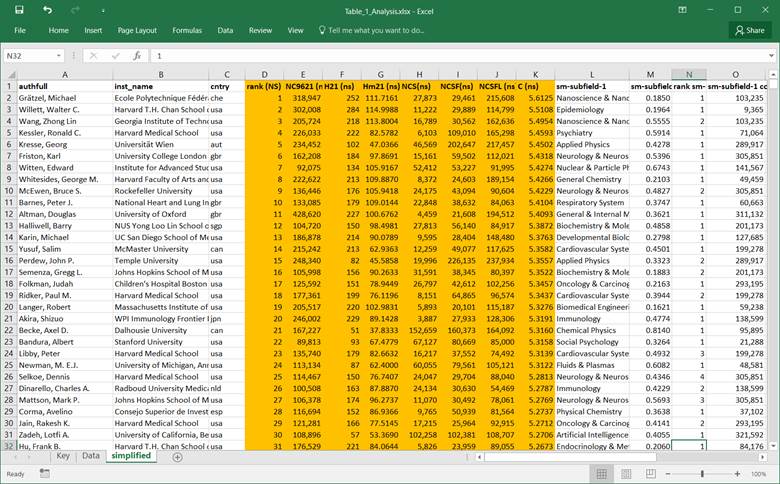
For researchers from RWTH Aachen University, the table looks
as follows:
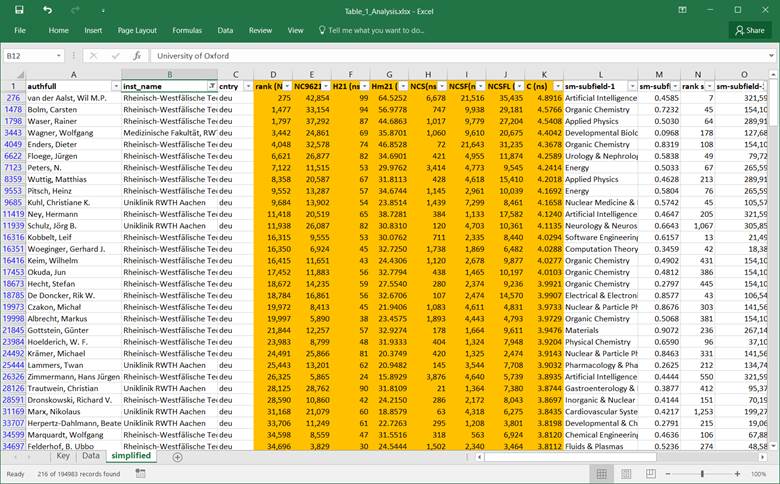
For researchers working in
Germany, the table looks as follows:
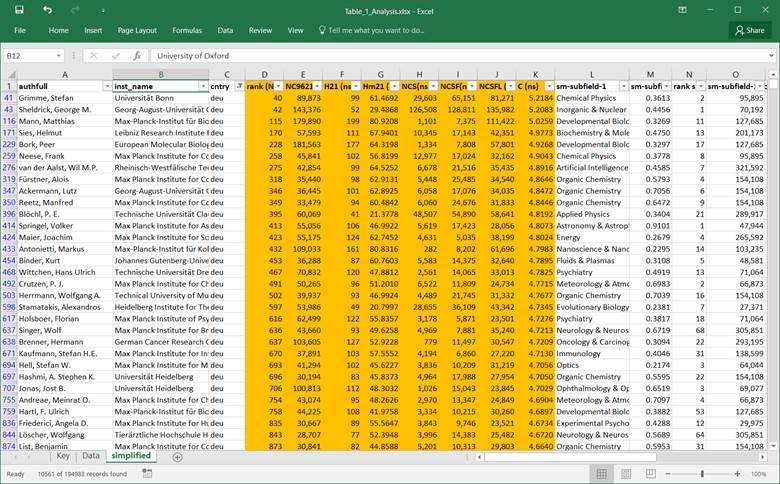
For researchers working in
The Netherlands, the table looks as
follows:
The people having Artificial Intelligence & Image
Processing as the first subfield, the table looks as follows:
Readers
interested in creating their own analyses can download the dataset created by
John Ioannidis and his colleagues [2] and read the supporting articles [3,4,5]. In my view, this is a great initiative to address the
apparent problems related to naively counting papers and citations. As usual,
the impact of scientific work can only be measured
after some time. Hence, measures such as the C-score should not be used to
evaluate early career researchers. However, it could help younger
researchers to set goals. Also, one should never
forget the first principle of the Leiden Manifesto for research metrics [1]:
“Quantitative evaluation should support qualitative, expert assessment.
Quantitative metrics can challenge bias tendencies in peer review and
facilitate deliberation. This should strengthen peer review, because making
judgments about colleagues is difficult without a range of relevant
information. However, assessors must not be tempted to cede decision-making to
the numbers. Indicators must not substitute for informed judgment. Everyone
retains responsibility for their assessments.” However, as also demonstrated in
[8], it is very well possible to conduct
a fair and inclusive cross-disciplinary comparison of research performance
using Google Scholar or Scopus as a data source and more refined measures that
correct for the number of authors.
References
[1]
Hicks, D., Wouters, P., Waltman, L. et al. Bibliometrics (2015), The Leiden Manifesto for research
metrics. Nature 520, 429–431, https://doi.org/10.1038/520429a
[2] Ioannidis, J. (2022), “September 2022 data-update
for “Updated science-wide author databases of standardized citation indicators””,
Mendeley Data, V5, doi:
10.17632/btchxktzyw.5 https://elsevier.digitalcommonsdata.com/datasets/btchxktzyw/5
[3] Ioannidis J., Klavans R.,
Boyack .
K. (2016), Correction: Multiple Citation Indicators and Their Composite across
Scientific Disciplines. PLOS Biology 14(8): e1002548. https://doi.org/10.1371/journal.pbio.1002548
[4] Ioannidis J., Baas J., Klavans
R., Boyack K. (2019), A standardized citation metrics
author database annotated for scientific field. PLoS Biol 17(8): e3000384. https://doi.org/10.1371/journal.pbio.3000384
[5] Ioannidis J., Boyack K.,
Baas J. (2020), Updated science-wide author databases
of standardized citation indicators. PLoS Biol 18(10): e3000918. https://doi.org/10.1371/journal.pbio.3000918
[6]
Recognition and
Rewards (“Erkennen en Waarderen”) program (2019), an initiative by
VSNU, NFU, KNAW, NWO and ZonMw,
https://recognitionrewards.nl/
[7] COARA (2022), Agreement on reforming research
assessment, https://coara.eu/.
[8] Harzing, AW., Alakangas,
S. Google Scholar, Scopus and the Web of Science: a longitudinal and
cross-disciplinary comparison. Scientometrics 106,
787–804 (2016). https://doi.org/10.1007/s11192-015-1798-9